Base Image Optimization for Faster Sandbox Startups
Optimizing what goes into sandbox base images cuts cold-start time from minutes to seconds.

Sandbox startup latency comes down to a handful of decisions about what goes into the base image and how it gets restored. Cursor alone accepts almost a billion lines of code a day, and every one of those runs through a sandbox provisioning path at some point, which turns cold-start time from a background metric into something that shapes the product itself. When an agent makes a synchronous tool call, it waits on that sandbox to spin up, and if the wait stretches long enough, the reasoning chain is interrupted and the agent can't execute the precise, targeted action it was working toward. Cold-start time isn't a DevOps line item anymore, and for any team shipping AI agents, treating it as one is the first mistake.
Where the time goes during a sandbox cold start
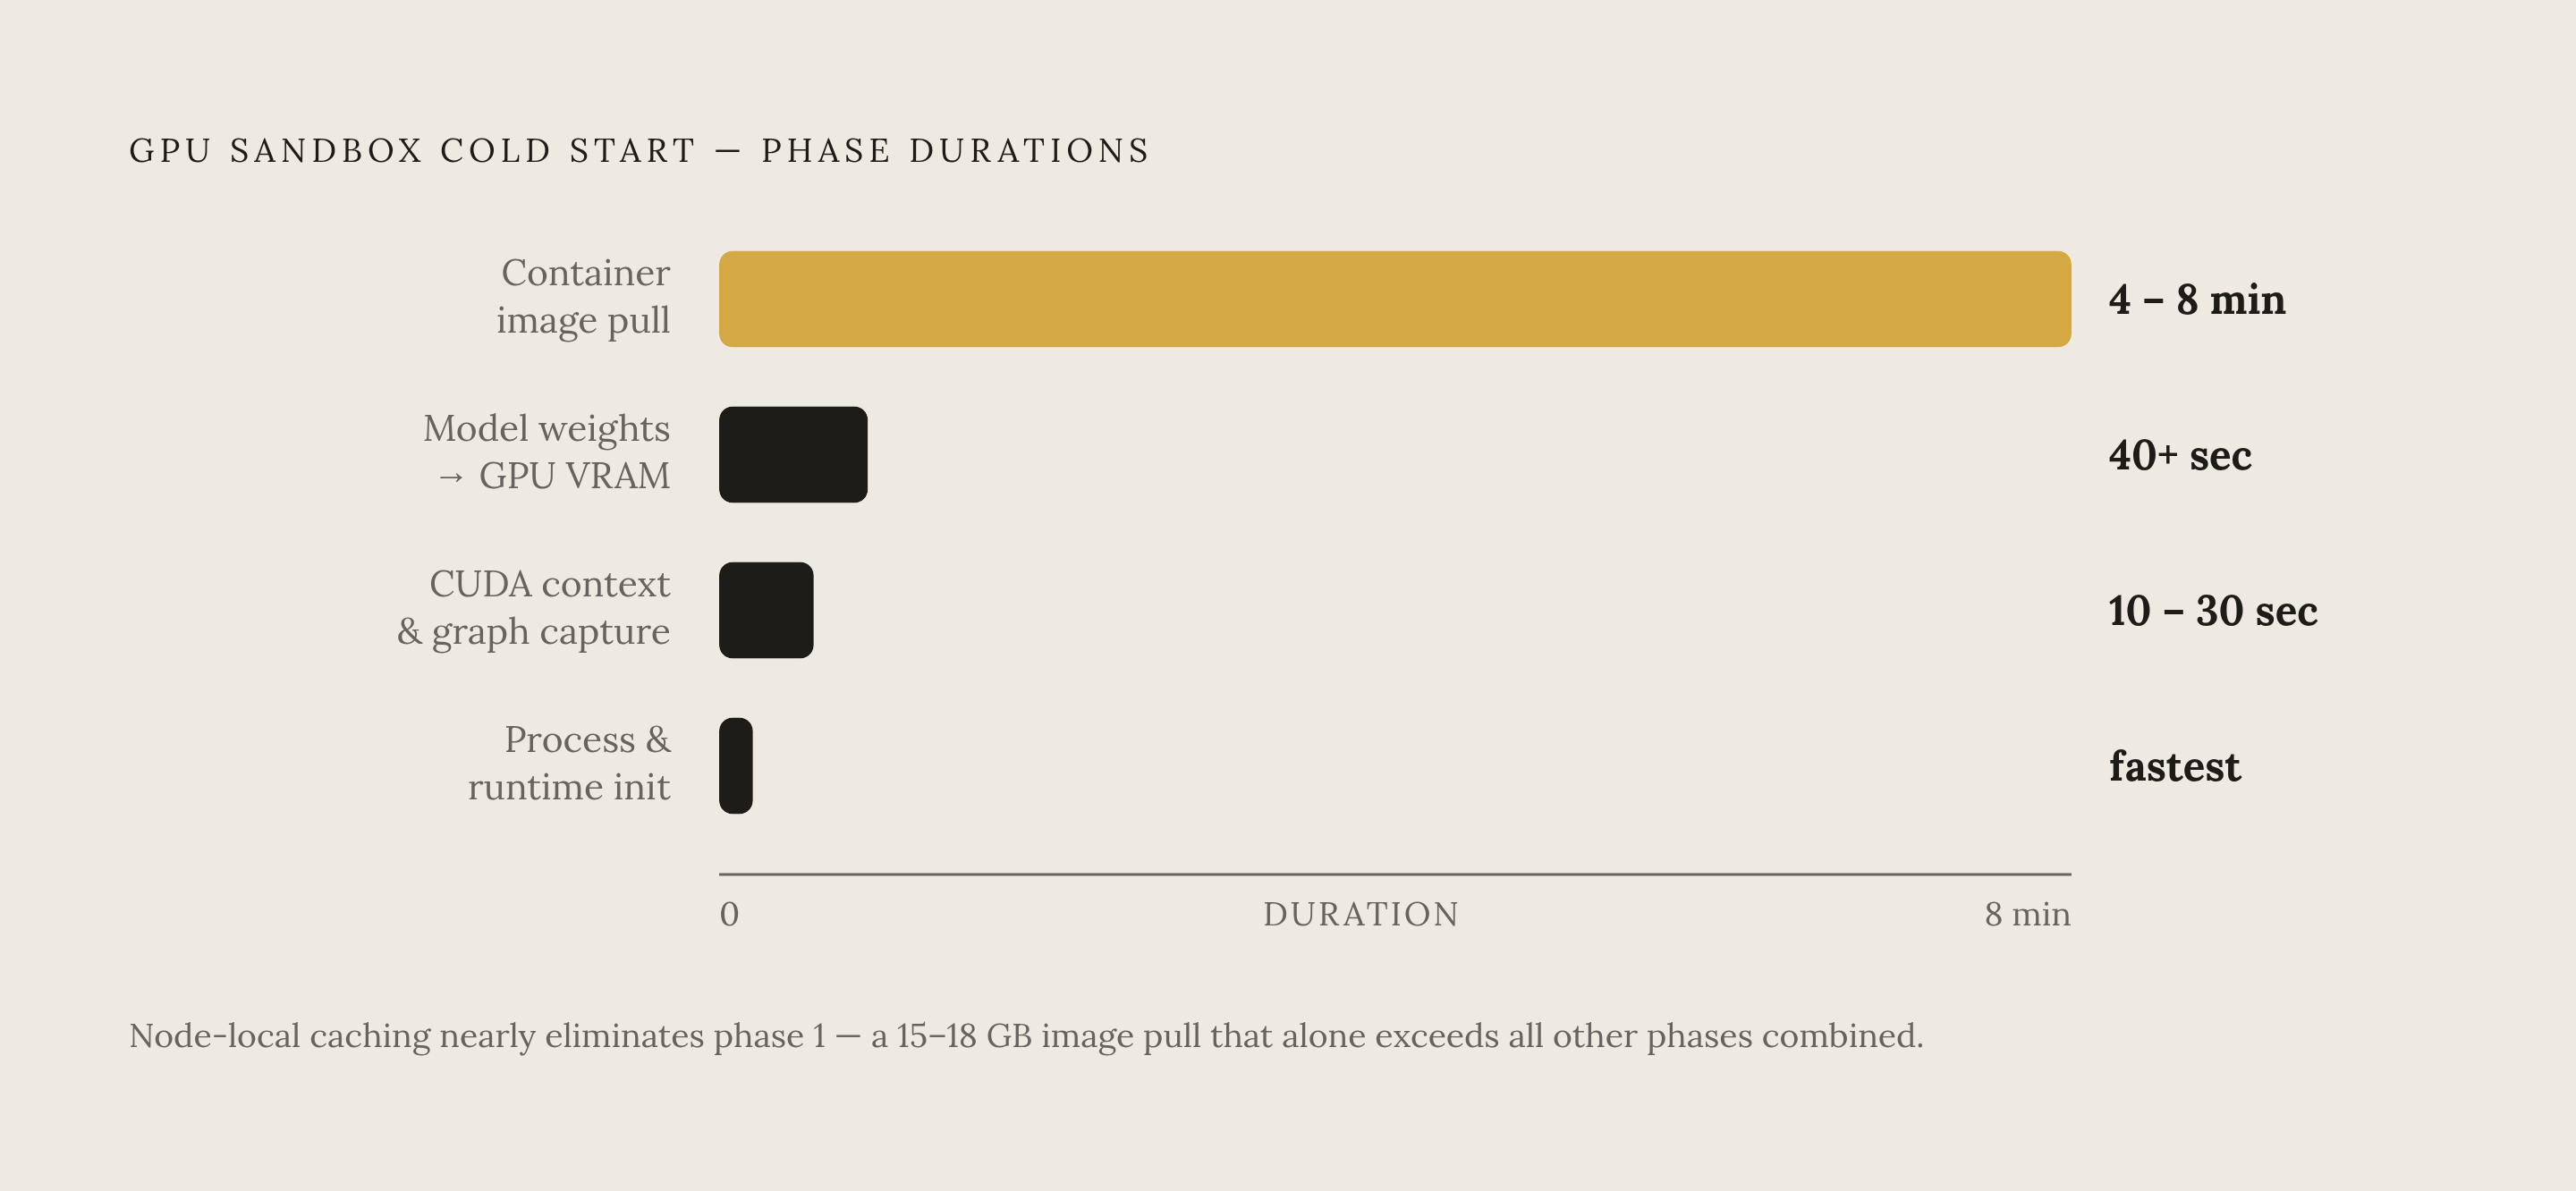
Breaking down a GPU-capable sandbox boot reveals four distinct phases, each with its own cost structure, and they are not equally fixable. Most teams spend their engineering hours on the wrong phase.
The first, and usually the dominant one without caching, is the container image pull. A full LLM-serving image, the kind bundling Python, CUDA, PyTorch, and vLLM along with all their transitive dependencies, typically runs 15 to 18 GB, and pulling that over the network without node-local caching takes 4 to 8 minutes. That's minutes spent before a single line of the application even starts. After the pull comes model weight transfer, moving weights from storage into GPU VRAM. For a large model at typical NVMe throughput, that phase alone eats 40-plus seconds. Then CUDA context initialization and graph capture tack on another 10 to 30 seconds. Only after all that does process and runtime initialization kick in: application startup and the server actually coming online.
Stripping out the GPU makes the picture simpler, but it doesn't disappear. CPU-only agent sandboxes skip the weight transfer and CUDA phases entirely, but the image pull and process init remain, and this is exactly where base image decisions start to matter most. Image pull is a one-time network cost, and caching removes almost all of it. Process init is structural. It requires either trimming the image down so there's less to initialize, or bypassing initialization altogether through a snapshot. Treating those two problems as if the same fix applies to both is where a lot of engineering time gets burned for no return.
Three terms carry the rest of this piece. A cold start means no cached image and no warm sandbox waiting, the full 4-to-8-minute pull plus every phase after it. A warm start means the image is cached, but the process still has to initialize from scratch. Snapshot resume means restoring from a memory snapshot, which skips initialization. The optimization story that follows is really the story of moving a workload from the first bucket to the third, and skipping the middle step is usually the point.
How the choice of isolation layer shapes optimization possibilities
Isolation isn't a security question bolted onto the end of a performance conversation. It sets the ceiling and the floor on cold-start speed before a single optimization gets applied, and it decides which acceleration techniques are even available to reach for. Get this choice wrong and no amount of image trimming downstream fixes it.
Plain containers, sharing the host kernel, boot the fastest of the three options here, and that speed is exactly the problem. CVE-2025-59528 demonstrated that shared-kernel isolation isn't sufficient for untrusted code running in production AI agents. The "Leaky Vessels" vulnerability in runc demonstrated a similar failure mode: file-descriptor leaks that let a process escape the container and reach the host. Plain containers make sense only where the threat model specifically tolerates that risk, and for untrusted agent code, that's rarely a defensible default, whatever the boot-time numbers look like on a benchmark slide. Choosing containers here means the choice isn't really about speed anymore, it's about which incident report gets written first.
gVisor sits in the middle. It runs as a user-space kernel, intercepting syscalls before they touch the host kernel, which shrinks the attack surface considerably. The tradeoff is a real but bounded performance hit, somewhere around 10 to 30% on I/O-heavy workloads, while still keeping fast startup otherwise. Because it stays compatible with standard container image workflows, every image-layer optimization discussed later in this piece applies to it directly, no modification needed.
Firecracker microVMs push isolation further, giving each sandbox its own dedicated kernel, the strongest boundary of the three for untrusted code. The cost is a slower raw cold start compared to containers, and the fix for that isn't a faster boot sequence, it's sidestepping the boot. Pre-warmed snapshot pools bring resume time down to roughly 150ms. Each Firecracker VM needs its own kernel image and memory allocation, so base image discipline here affects not just pull time but the memory footprint of the whole fleet.
A lot of teams get this tradeoff backward. They pick containers for speed, hit an incident like Leaky Vessels, and only then discover that the isolation layer was never something to bolt on after the fact. Picking gVisor or Firecracker from the start costs some raw milliseconds. Retrofitting isolation onto a fleet already built on plain containers costs a rebuild, and that's the more expensive bill by a wide margin.
Trimming the base image
The monolithic image is the most common mistake here, and arguably the easiest one to fix once someone actually looks at it. Bundling every dependency a project might ever need into one image maximizes both pull time and the odds of a layer cache miss on the next build. Among teams that haven't examined this problem directly, it's the single most frequent cause of slow cold starts, and it's usually not a hard problem once flagged, just a neglected one. Nobody sets out to build a 16 GB image. It happens one pip install and one forgotten dependency at a time.
The fix starts with a simple separation between what's always needed, the base runtime, and what's task-specific: the domain libraries, model weights, and project files that change from job to job. Once that split exists, minimal base selection becomes possible. Favor slim or distroless variants. Strip out package managers, documentation, and build tools that have no business being in a runtime image. Research on this describes the ideal as "a lightweight and general-purpose base image equipped only with a standard interpreter and essential libraries," and that phrase doubles as a useful test to run against any image before shipping it. Does this binary need to be here for the sandbox to run, or is it just here because nobody got around to removing it?
Layer ordering matters just as much as content, and teams skip it because it doesn't appear as a line item anywhere. Put the slow-changing, large layers (the OS and runtime) at the bottom of the image. Put the fast-changing, small layers (application code and config) at the top. Docker and most container runtimes cache layers by content hash, so anything that never changes between builds gets served straight from cache. The pull cost for those layers drops to close to zero on any node that's already seen them.
Filesystem caching and layered mounts: separating static images from dynamic state
Node-local caching solves one specific problem: after the first pull on a given node, every subsequent cold start on that same node skips the network fetch. That's the gap between a 4-to-8-minute first pull and a sub-second warm cold start on the next request. It's a mechanical fact about how container runtimes work, and it stays ignored right up until someone actually measures the difference and sees the number staring back at them.
The pattern that falls out of this naturally: keep one lean, always-cached base image, and attach the task-specific overlay at mount time. The base image itself never needs to change even as the project files inside it evolve from run to run. That separation is the whole trick. Mix static and dynamic state in the same layer and every cache gets busted the moment anything changes, defeating the point of caching. Filesystem snapshots fit into this picture as the stable option, restoring on-disk state directly without re-running any of the initialization logic that would normally fire on a fresh boot.
Pre-warmed pools and memory snapshots: bypassing initialization entirely
If the bottleneck is process initialization (server startup, dependency imports, cloning a repo), spending engineering effort speeding that sequence up brings a marginal payoff at best. The better move is doing it once, capturing the result, and restoring it on every request after that. Trying to shave milliseconds off a boot sequence when the real fix is skipping the boot is a classic case of optimizing the wrong thing well.
Pre-warmed pools do exactly this at the infrastructure level. A pool of sandboxes sits ready, already booted and past all their init work, before any request arrives to claim one. The result is a set of pre-booted sandboxes on standby, cutting cold-start latency to sub-second without needing custom autoscaling logic bolted on separately. Nothing here is free, though. Idle warm sandboxes sit there consuming memory and processing capacity whether or not a request ever shows up to use them, so pool size has to be tuned against actual traffic patterns. Get that tuning wrong in one direction and compute gets wasted. Get it wrong in the other, and the exact latency problem the pool was built to solve comes right back.
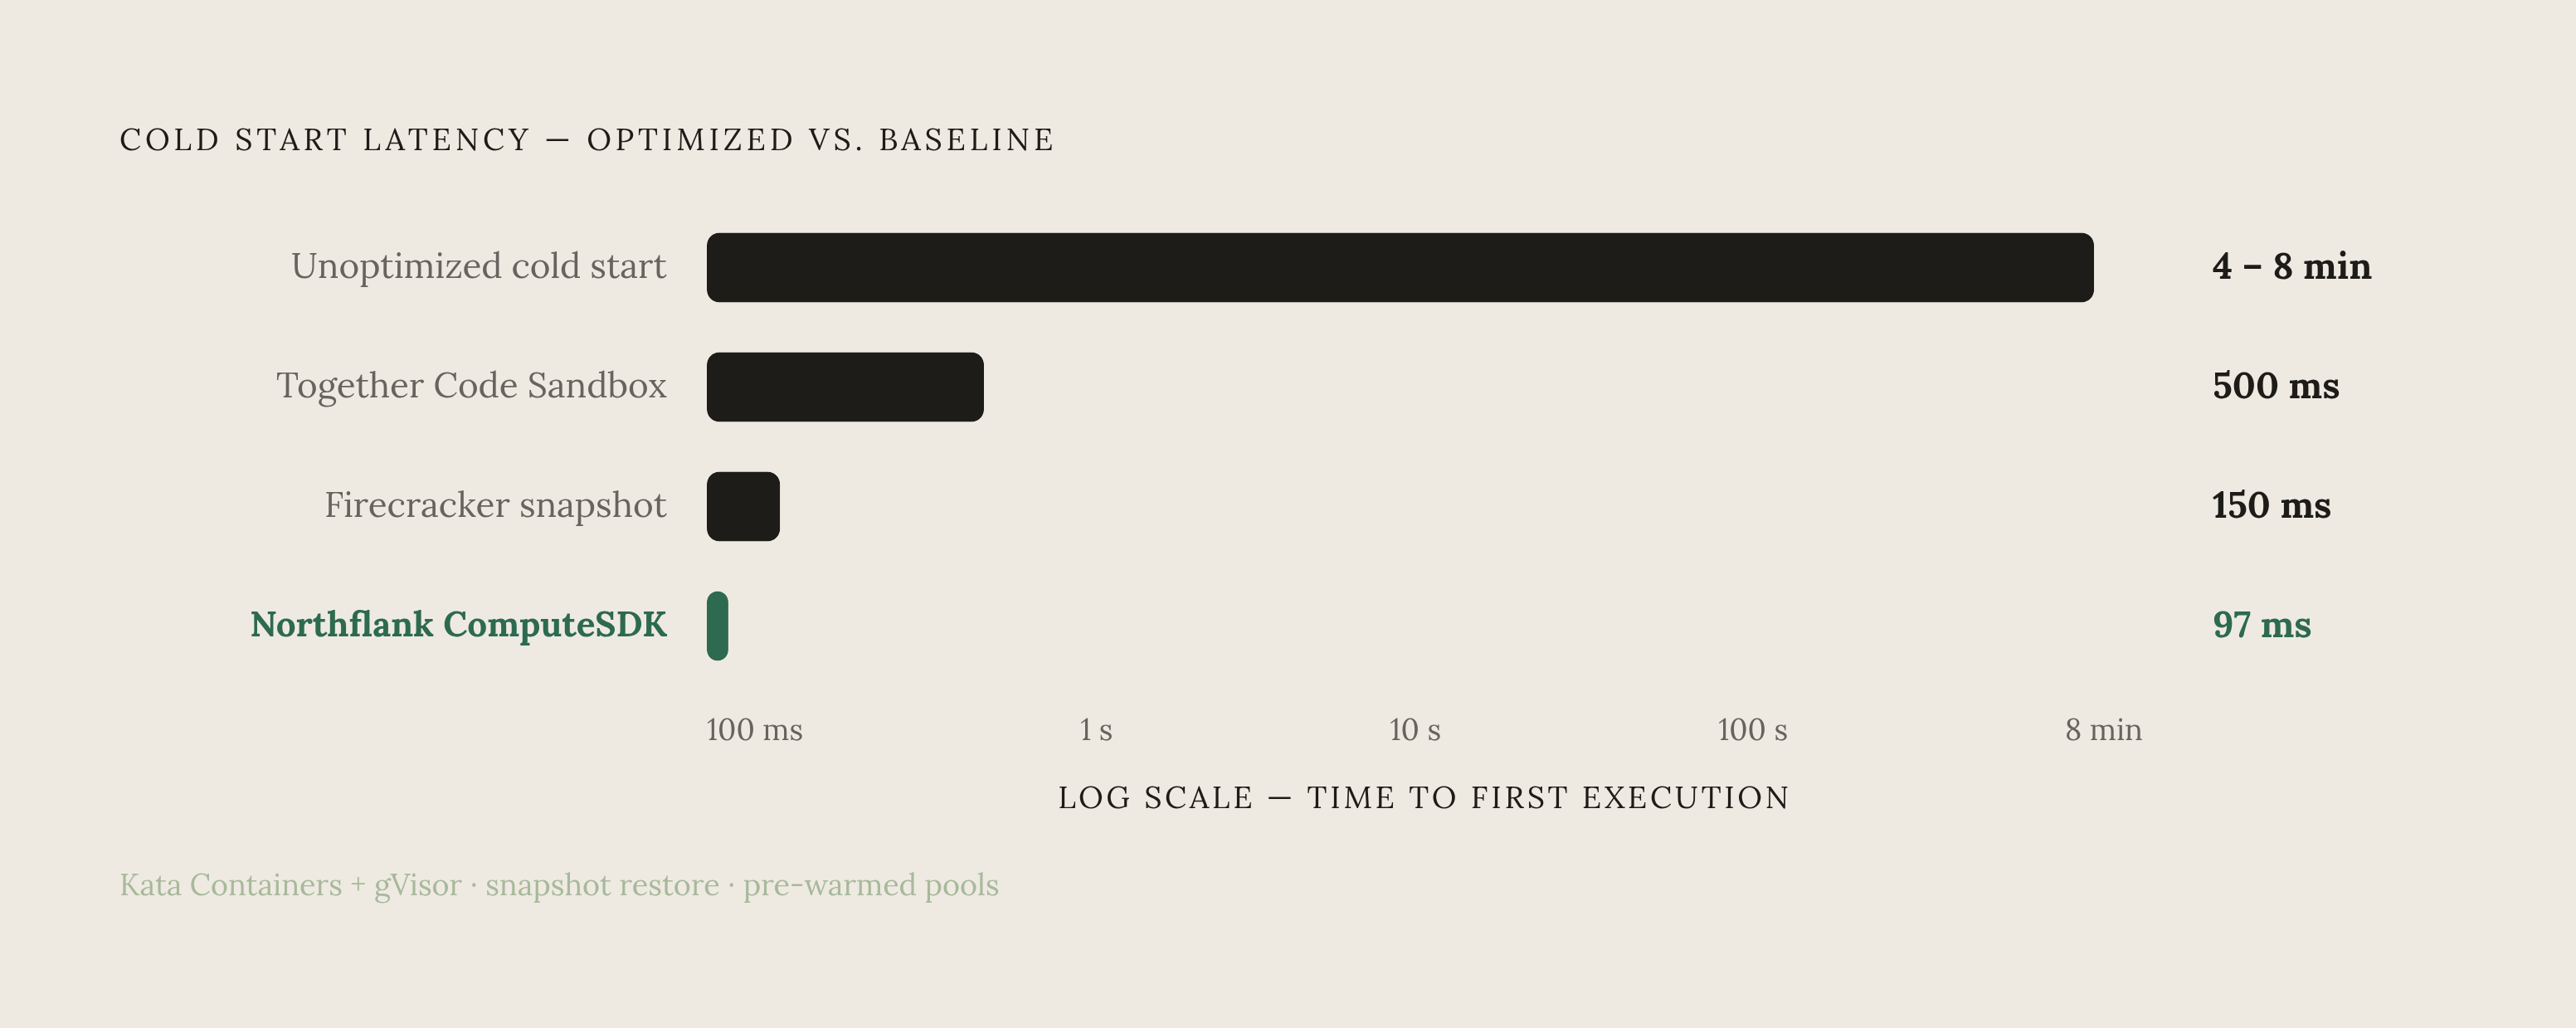
Memory snapshots take the same idea and apply it inside a single sandbox rather than across a pool. Capture the complete in-memory state of a fully initialized sandbox, and restore it directly the next time a request comes in. Firecracker's pre-warmed snapshot approach works this way: instead of booting a kernel from zero, an incoming request restores straight from the snapshot, landing around 150ms. Together's Code Sandbox reports a 500ms snapshot resume, slower than Firecracker's figure but still fast enough for a lot of asynchronous work.
These techniques compound rather than operate independently. A trimmed base image produces a smaller snapshot. A smaller snapshot restores faster. And a warm pool means the very first request in a burst of traffic never has to wait on a restore at all, because a sandbox is already sitting there, initialized and idle, ready to take it.
Production numbers when these techniques are applied together
The field has landed on a range wide enough to explain the gap between the fastest and slowest numbers on offer, and that spread isn't random. It maps directly onto the decisions covered above.
Northflank reports a 97ms median time-to-interactive per the ComputeSDK benchmark, and during the ComputeSDK 2026 Scale Invitational, the platform reached 100,000 concurrent live sandboxes in 24 seconds starting from a cold start. That's running Kata Containers alongside gVisor isolation, across a claimed 2 million isolated workloads a month. Firecracker-based platforms using pre-warmed snapshots resume in around 150ms, a number that reflects the tradeoff described earlier, with snapshot restore doing most of the heavy lifting to achieve that figure. Together's Code Sandbox resumes from a snapshot in 500ms, still well within range for a lot of asynchronous workflows, though noticeably slower for the kind of synchronous, back-to-back tool calls an agent makes mid-reasoning.
So what actually explains the spread? Isolation layer choice accounts for some of it. Image size and layering discipline account for more of it. Whether a platform is restoring from snapshot versus booting fresh explains most of what's left. None of these numbers happened by accident. They're the direct output of the design decisions covered in the sections above, and a team that skips straight to chasing a 97ms number without doing the image-trimming and caching work first is chasing the wrong variable, full stop.
Security controls that base image design must not sacrifice for speed
Five controls need to hold regardless of how lean an image gets. Network egress on a default-deny basis. Filesystem boundaries that scope the sandbox to its own workspace. Process isolation through a dedicated kernel. Secrets scoping, so that credentials never actually enter the sandbox environment. And an ephemeral lifecycle that leaves no residual state behind unless someone explicitly opts into keeping it.
The Snowflake Cortex Code CLI incident shows what happens when one of these controls fails, even in an otherwise reasonable setup. Indirect prompt injection combined with weak command validation let AI-generated instructions bypass human-in-the-loop approval, escape the CLI's sandbox mode, and reach live Snowflake credentials. That's a direct warning against treating a minimal image as an automatically secure one. Trimming and hardening are different jobs, and doing one well says nothing about whether the other got done.
Image trimming reduces what an attacker can do inside the sandbox, but it does nothing against kernel-level escape, and confusing the two is the mistake behind more than one bad incident report. Pulling curl, wget, and package managers out of the base image shrinks what malicious code can do if it manages to execute. But a slim image running on a shared-kernel container runtime is still exposed to the failure class that shared-kernel isolation leaves open. For that category of threat, the isolation layer determines the outcome more than anything sitting inside the image, and no amount of stripping binaries out of a container substitutes for a dedicated kernel boundary. One pattern gaining traction for network isolation specifically is a per-sandbox TAP device paired with eBPF policy enforcement, an approach that layers on top of any image design without requiring changes to what's inside the image itself.
Putting it together: a decision sequence for teams optimizing sandbox startup
Order matters here, because later choices depend on earlier ones holding up, and doing this out of sequence is where most of the wasted effort in this whole space comes from. Start with the isolation layer. That decision sets the ceiling on both security posture and how fast any cold start can realistically go, and it can't be revisited cheaply once a platform is built around it. Get this one wrong, plain containers for untrusted agent code, say, and every optimization downstream is built on a foundation that a single container-escape vulnerability can knock out from under it.
From there, trim the base image: strip unnecessary binaries, split static runtime from dynamic task-specific state, and order layers so the slow-changing pieces sit at the bottom where caching helps most. Once the image itself is lean, node-local caching becomes worth the investment, because caching a bloated image still leaves a bloated image sitting in cache, just a cached one now instead of a slow one. Only after that does it make sense to reach for pre-warmed pools or memory snapshots. A smaller, well-cached image produces a smaller, faster-restoring snapshot, while a badly designed image makes for a slow, bloated one no matter how good the restore mechanism is.
Security checks belong at every step in this sequence, not tacked onto the end as a final audit. Network egress rules, filesystem scoping, and secrets handling all need to hold at the same strength for a sandbox that takes 8 minutes to cold-start and one that takes 97 milliseconds to restore from snapshot. Speed and security trace back to the same set of decisions, isolation and image design, made early, and made on purpose. If teams skip that ordering and chase the latency number first, the security work either gets bolted on later at a much higher cost, or never gets done.
Sources
- What’s the best code execution sandbox for AI agents in 2026? | Blog — Northflank
- Top AI sandbox platforms in 2026, ranked | Blog — Northflank
- A release bump costs a sandbox-readiness casualty on every cold node: image pull competes with the 2-minute deadline · Issue #1025 · chughtapan/moltzap
- cerebrium.ai
- spheron.network
- kodekloud.com
- oneuptime.com
- cerebrium.ai