Concurrency Limits and Scaling Behavior in Managed Sandboxes
Shape of demand, not volume, determines whether a sandbox platform survives production scale.

Concurrency limits and cold-start behavior get baked into a sandbox platform's design from day one, and they decide whether an agent workload that runs fine in a demo falls over in production. Most teams find this out the hard way: the demo handles ten sandboxes without a hitch, and then the same code, pointed at real traffic, stalls out somewhere past a thousand. This piece walks through what bottlenecks first when an agent system scales from a handful of sandboxes to thousands running in parallel, why the isolation technology underneath matters more than most teams assume, and where the cost math shifts enough to justify moving off a managed platform.
Spinning up one sandbox, or ten, is not a hard problem. Almost any orchestration layer can boot a handful of isolated environments and keep them alive long enough to run an agent's tool calls. The friction appears once the count climbs into the thousands and every environment needs to be isolated, provisioned in under a second, and ready to do real work almost immediately. That gap between dev-scale and production-scale is wider than it looks from the outside, and most teams underestimate it until a launch forces the question.
Rate limits, oddly enough, tend to become the binding constraint before raw concurrency does. A cold start of a second or two is annoying at ten sandboxes and invisible in a demo. At ten thousand, that same cold start turns into a structural bottleneck: provisioning queues back up, and every dependency in the startup path gets hit at once instead of one at a time.
Measuring "high concurrency" honestly means breaking it into five separate numbers, because a single figure like "we ran a million sandbox executions last month" hides almost everything that matters. Live concurrency is how many environments are consuming runtime capacity at a given instant, not over a month. Start throughput is how many environments get admitted and begin provisioning per unit time. Time to interactive is the wall-clock delay between a request being accepted and the sandbox actually being ready for work, a different number than "booted." Active duration measures how long an environment holds onto compute before it pauses or terminates. Resource shape covers the CPU, memory, storage, network, and increasingly GPU profile each sandbox needs.
A platform can report a large monthly total while its live concurrency at any given second stays modest, simply because the load spreads evenly across weeks. Ten thousand sandbox starts arriving in one minute is a completely different engineering problem than ten thousand starts spread across a day, even though the monthly total looks identical on a dashboard. The shape of demand, not its total volume, is what stresses a platform's provisioning path. Anyone evaluating a platform off a single "executions per month" number on a pricing page is asking the wrong question. Pricing pages lead with that number because it hides the shape of demand.
What bottlenecks first: admission, networking, and isolation overhead
Three distinct failure modes get lumped together under "the platform is slow," but they hit at different thresholds and for different reasons. Conflating them is how postmortems go nowhere: the fix for one does nothing for the other two, and a team that treats them as one problem ends up patching the wrong layer.
Admission bottlenecks happen before a single sandbox even boots. Authentication, quota checks, and placement decisions decide whether a request is even allowed to proceed, and this bookkeeping can slow burst starts to a crawl on its own. Provisioning bottlenecks come next: host readiness, image pulls, filesystem setup, the work that happens after a request clears admission but before the sandbox is actually interactive. Then there's the steady-state concurrency ceiling, a hard cap set by whatever tier or plan a platform assigns, and this one has nothing to do with how fast the provisioning pipeline runs. A platform can provision instantly and still reject requests the moment it hits that ceiling.
Networking is the clearest, best-documented example of where this bites. At sufficiently high parallel sandbox starts, the work of setting up CNI plugins and virtual switches for each new environment becomes the primary constraint. The plumbing connecting the sandbox to the network chokes first. Pushing past that threshold without fixing the networking setup means no amount of faster boot time saves the system. It's the wrong lever.
Isolation technology adds its own overhead, and that overhead compounds differently depending on which primitive a platform runs on. Firecracker microVMs draw a hardware-level boundary between tenants and boot in under 125 milliseconds, but each one needs its own network interface configured, and that per-VM setup work multiplies as concurrency climbs. gVisor takes a different approach, intercepting syscalls in user space instead of virtualizing hardware, with a lighter footprint on the host but reduced I/O throughput compared to full virtualization. V8 isolates skip the OS boot process entirely and start almost instantly, but they're locked into JavaScript and Wasm runtimes, which rules them out for general-purpose agent execution that needs to run arbitrary code.
Northflank's scaling guide from August 2026 draws a useful line: global admission (quota checks, region selection, idempotency) is a separate concern from local placement (scheduler decisions, host capacity, image locality). Most homebrew sandbox orchestration setups conflate the two, routing every decision through a single code path, and that's exactly where they break under burst load. Keeping admission and placement apart is not optional for a system meant to survive real traffic. A burst degrades gracefully with that separation in place, and takes the whole system down without it. Teams that build their own orchestration layer and skip this split are, whether they realize it or not, betting that they'll never see a real burst. That bet tends to lose.
Cold-start latency across isolation primitives and its cost to an agent workflow
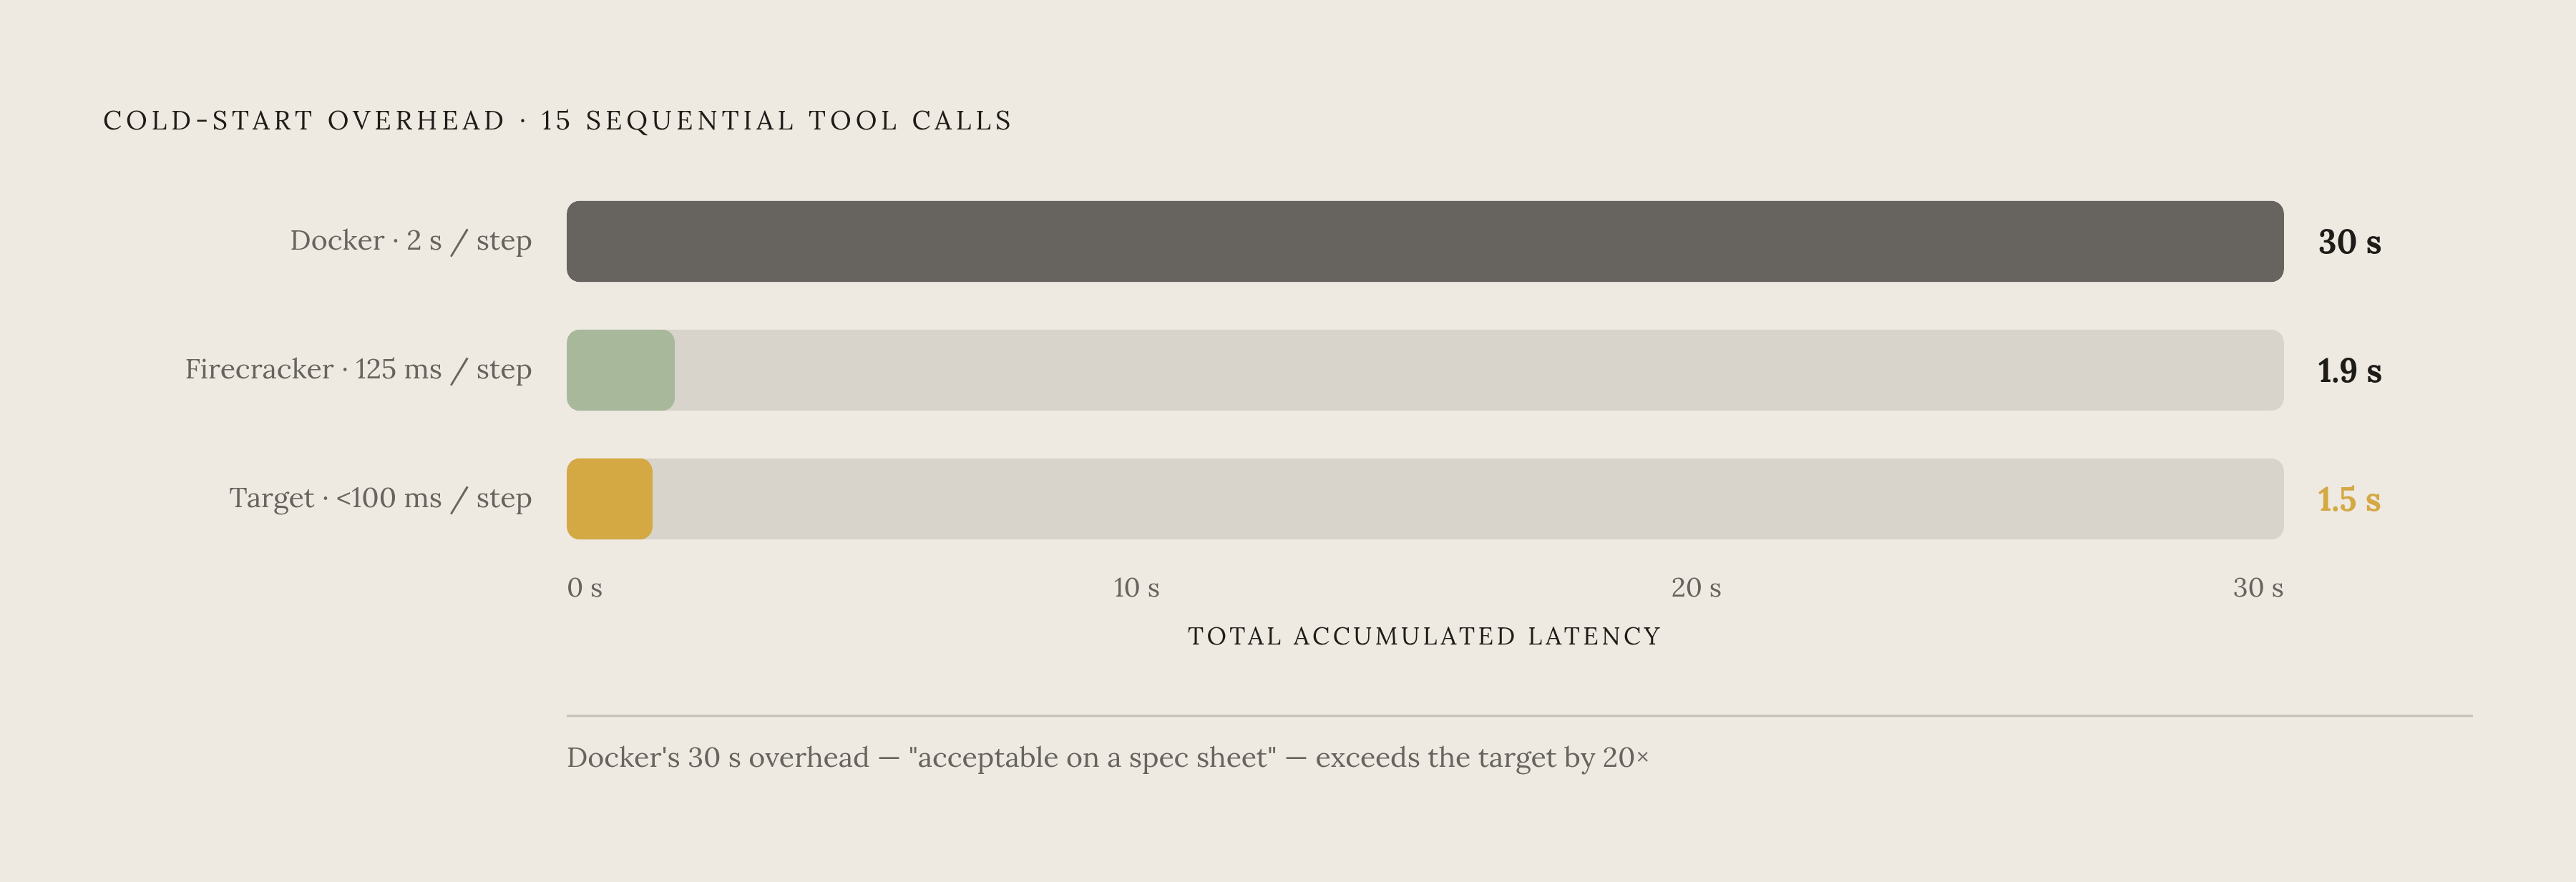
The raw numbers, lined up, tell a clear story. Firecracker microVMs cold-start around 125 milliseconds. Kata Containers, running on a microVM baseline, is around 200 milliseconds. Docker-based approaches run 1 to 3 seconds. That range looks small in isolation, a second or two, who's counting? But agent workflows rarely make one call.
They chain tool calls together, and each one may need its own sandboxed environment or its own execution step inside a persistent one. Take a workflow with 15 sequential tool calls. At a 2-second cold start per step, that's 30 seconds of pure waiting stacked on top of whatever the actual work takes, and a user staring at a spinner has no way to tell whether the agent is thinking or the agent is stuck waiting on infrastructure. Bring that cold start under 100 milliseconds instead, and the same 15-step chain drops under 2 seconds of accumulated overhead.
The agent feels responsive with that fix in place, and feels broken without it. The user never sees the infrastructure that produces the wait, only the wait itself, and that wait is the entire product experience because it's the only part of the system the user can actually perceive or judge. Docker-based sandboxing, on that math, isn't a viable choice for anything resembling a multi-step agent. A 1 to 3 second cold start per step looks acceptable on a spec sheet, but it falls apart the moment a real workflow strings ten or fifteen of those steps together.
The architectural decisions that determine whether a platform scales
Separating admission from placement is the single decision that keeps burst demand from cascading straight into the runtime layer, and platforms that skip it pay for it the first time real traffic arrives. Global admission handles authentication, authorization, quota checks, region or cell assignment, and issuing an idempotency key, all before a request ever touches a scheduler. Local placement then handles which host actually gets the workload, based on capacity and image locality. Collapse the two into one path, and a burst of a thousand simultaneous requests forces every single one through the same slow, serialized decision tree.
Cell architecture is how platforms contain failure once they're running at real scale. A cell is a bounded group of clusters or hosts, with its own capacity ceiling and its own failure radius, so a bad deploy or a hardware failure in one cell stays inside that cell instead of taking down tenants somewhere else. Kubernetes v1.36's guidance on large clusters describes a tested envelope of around 5,000 nodes and 150,000 pods per cluster, though cloud provider quotas often box in real-world growth well before a cluster gets anywhere near that ceiling. Teams typically stand up a new cell when an existing cluster nears its tested safe capacity, when control-plane pressure starts slowing down how quickly new pods become ready, when certain workloads need a separate runtime environment from others, or when a single failure in one cluster would take out too many tenants at once. Detailed runtime state stays local to its cell instead of getting funneled through one global service; a global service handling every status update from every sandbox everywhere would turn a regional blip into a platform-wide outage.
Once a platform runs under real load, warm capacity and image locality decide performance more than raw boot speed does, and this is where a lot of teams misdirect their engineering effort chasing the wrong number. A 125-millisecond Firecracker boot means nothing if the host still needs to pull a container image, mount a filesystem, and fetch credentials before the sandbox can do anything, because those steps, not the VM boot itself, tend to be the slowest part of the whole path. Chasing a faster VM boot time while ignoring image pull latency is optimizing the part of the pipeline that was never the bottleneck. The fix is to pre-stage all of that outside the startup path entirely, so the slow work has already happened by the time a request comes in.
That's the logic behind warm pooling: environments get pre-started and finish their setup, cloning the relevant repo, installing dependencies, starting a server, before anyone is actually waiting on them. Perceived latency drops close to zero, because the provisioning happened earlier, off the critical path, where the user never has to feel it.
Managed platform concurrency limits and scaling behavior
Judging a sandbox platform off a feature checklist misses the point. The dimensions that matter are the ones laid out above: live concurrency, start throughput, time to interactive, which isolation primitive runs underneath, and how the pricing model behaves as usage climbs.
Northflank is the platform with the clearest published benchmark data on this front, and it isn't close. At the ComputeSDK Scale Invitational on June 18, 2026, Northflank reached 100,000 concurrent live 1-vCPU sandboxes in 24 seconds, a number that came out of a named third-party benchmarking event rather than an internal marketing deck. Separately, ComputeSDK's own benchmarks recorded 97 milliseconds for sequential starts, a median time-to-interactive of 167 milliseconds under concurrent burst load, and a P99 of 216 milliseconds, meaning even the slowest sliver of requests still cleared interactivity in about a fifth of a second.
On isolation, Northflank gives teams a real choice instead of locking them into one primitive: Kata Containers with Cloud Hypervisor, Firecracker, and gVisor are all available as selectable options depending on what the workload actually needs. The platform also runs as a full-stack control plane, meaning sandboxes execute alongside databases, background workers, GPU workloads, and APIs in the same environment, which matters for any agent pipeline that needs more than just an isolated box to run code in.
There's no published hard concurrency cap on Northflank's managed cloud tier. The autoscaler handles scheduling at the infrastructure level instead of gating usage behind a fixed plan limit, and billing follows actual usage rather than a seat or tier structure. Teams that need to run their own infrastructure can bring their own cloud (BYOC) into AWS, GCP, Azure, Oracle, CoreWeave, Civo, on-premises hardware, or bare metal, self-serve, without an enterprise sales call standing between them and a working setup. Pricing runs $0.01667 per vCPU-hour and $0.00833 per GB-hour, with H100 GPU access at $2.74 per hour all-inclusive; BYOC deployments bill straight against the customer's own cloud account instead of through Northflank.
On compliance, Northflank holds SOC 2 Type 2 certification and supports SSO, role-based access control, scoped API roles, secret injection, private networking, and audit logs, the controls that actually matter once a platform handles production agent workloads with real customer data running through it.
cto.new migrated its sandbox infrastructure to Northflank in two days after costs on EC2 metal instances turned unpredictable and provisioning had grown unworkable at their scale. After the move, the team ran thousands of daily deployments billed on a linear, per-second basis instead of the step-function pricing they'd been stuck with before.
Taken together, this profile fits teams running thousands of concurrent sandboxes in production, platform engineering teams building multi-tenant agent infrastructure from scratch, and enterprise teams that need BYOC deployment options alongside certifications like SOC 2.
When managed concurrency limits become a cost crossover point
Concurrency limits eventually turn into a cost question, and the crossover point falls along fairly predictable lines tied to daily execution volume. Below a certain daily execution threshold, a managed service is the right call, full stop. Below that line, the choice between providers should come down to concrete requirements, security posture, GPU access, whether sandboxes need to persist state between sessions instead of staying fully ephemeral, and not to a spreadsheet exercise comparing self-hosted costs that don't apply yet.
Between roughly 1 million and 10 million daily executions, the calculus gets murkier, and it's worth actually running the numbers before deciding anything. The cost curves for managed and self-hosted infrastructure diverge somewhere in this range, so modeling the crossover on paper, calculating what self-hosted infrastructure would really cost at this scale against what the managed platform charges, beats guessing.
Above roughly 10 million daily executions, the balance tips decisively toward self-hosted infrastructure or a BYOC arrangement. At that volume, the fixed costs of running infrastructure directly tend to undercut per-execution managed pricing by a wide enough margin that the operational overhead of running it yourself becomes worth taking on. That's how unit economics behave at genuine scale: the pricing model that makes sense for a team running a few hundred thousand sandbox executions a day stops making sense once that number grows by two orders of magnitude, and no platform's pricing page volunteers that fact on its own. A team still paying managed per-execution rates once daily executions have grown by two orders of magnitude is, in effect, subsidizing the platform's margin instead of its own infrastructure. Running through the five dimensions laid out earlier, live concurrency, start throughput, time to interactive, active duration, and resource shape, against actual projected volume is what turns that crossover point from a guess into a number worth trusting.
Sources
- How to scale AI-agent sandboxes for high-concurrency workloads | Blog — Northflank
- Best platforms for high concurrency sandbox environments in 2026 | Blog — Northflank
- What’s the best code execution sandbox for AI agents in 2026? | Blog — Northflank
- What 100,000 concurrent sandboxes has taught us so far - ComputeSDK
- How to sandbox AI agents in 2026: Firecracker, gVisor, runtimes & isolation strategies