Memory and CPU Profiling Inside AI Sandbox Environments
Different isolation models require profilers that live inside the guest sandbox itself.

Sandboxes are now where most AI-generated code actually runs, and that shift breaks the assumptions engineers bring to performance work. This piece walks through what memory and CPU profiling actually looks like when the runtime is isolated, sometimes gone in seconds, sometimes running for days, and mostly out of reach of the tools a systems engineer would grab first.
Scale is the reason this matters. Cursor alone produces close to a billion lines of accepted code every day, and a meaningful chunk of that code runs somewhere before a human sees the output. That makes sandbox execution production infrastructure carrying real load, and a regression inside one of these environments appears on an invoice or in an incident channel, not just in a benchmark chart.
The same isolation boundary that keeps the host safe from buggy or malicious code also blocks the tooling engineers reach for by habit. perf needs kernel access it doesn't have. ptrace assumes a process tree it can't see. eBPF needs a kernel to attach probes to, and depending on the isolation model, there may be no kernel available at the layer where the code is actually running. None of that is a defect. It's isolation doing its job, and it forces a different approach to watching code run.
Add one more wrinkle: a growing share of sandboxes aren't short-lived anymore. Agents that hold state across tool calls, run for hours, and build up memory pressure over a session need profiling that behaves like a trend line. What follows covers how isolation architecture shapes what's visible, how in-process instrumentation works around the limits of a profiler stuck inside the guest, how to get that signal out through a locked-down network, what changes once agents run long instead of ending fast, and how all of it lands directly on a monthly bill.
How isolation technology determines sandbox observability
Three isolation approaches dominate production sandboxes today, and each one draws the visibility line somewhere different. Picking one decides, before any code runs, what an engineer will and won't be able to see later.
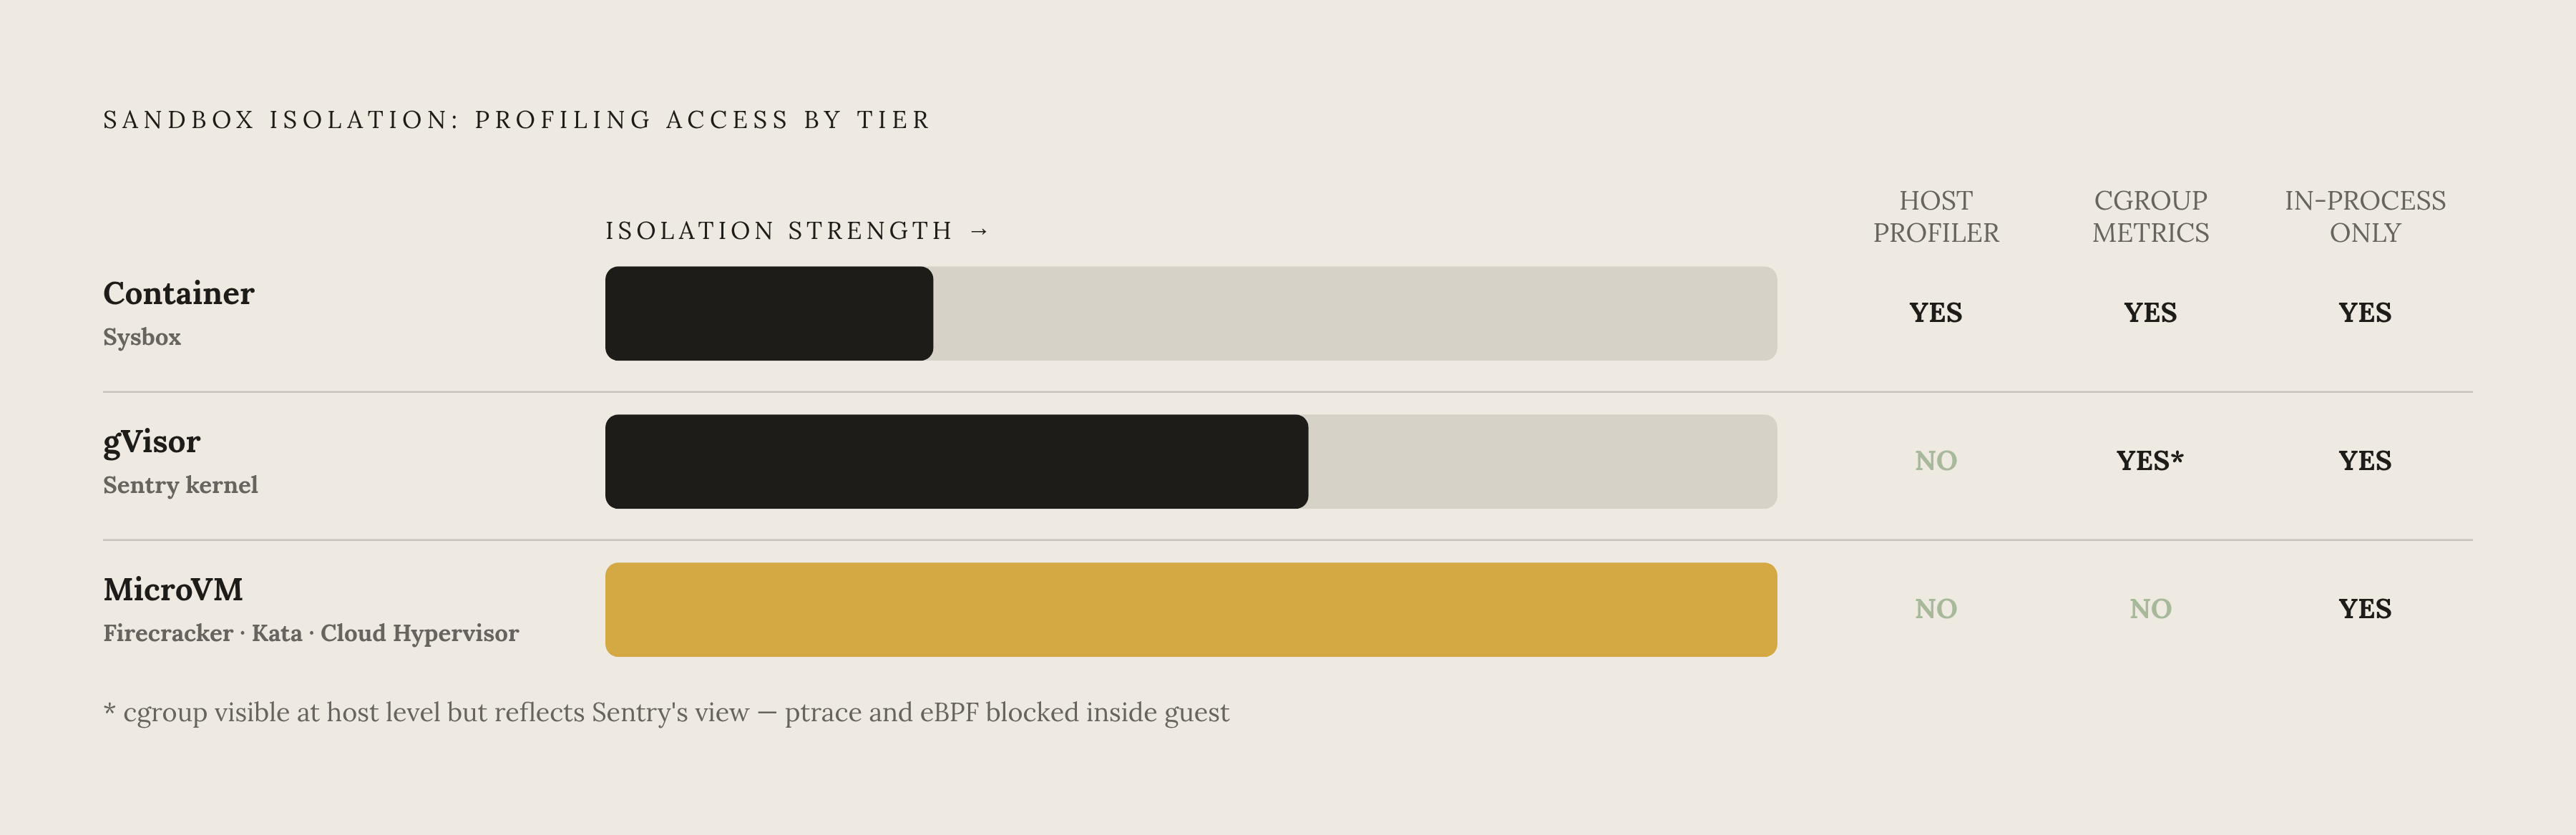
Container-based isolation, the kind specialized container runtimes like Sysbox use, sits closest to an ordinary container setup. Host cgroup metrics are visible, and host-side profilers can often attach if the runtime allows it. That's the upside, and it's a real one. The downside is that this is also the thinnest kernel boundary of the three: more of what runs inside the sandbox is visible from, and shares state with, the host. Sysbox describes its own model as VM-level isolation without hardware virtualization overhead, where root inside the sandbox maps down to an unprivileged user on the host. Good for observability. Weaker as a security boundary, and that tradeoff is the whole story with this tier.
gVisor takes a different path: it runs a user-space kernel called Sentry that intercepts every syscall the guest process makes. It runs a user-space kernel called Sentry that intercepts every syscall the guest process makes. Cgroup metrics still appear at the host level, but they reflect Sentry's view of resource use, not the guest process's own accounting of itself. ptrace doesn't work inside the guest. Neither does eBPF. So the only tooling that reliably works is instrumentation that lives inside the process being profiled, full stop. That's a hard constraint, not an inconvenience to work around, and it's the reason the next section of this piece exists.
MicroVM isolation, the model behind Firecracker, Kata Containers, and Cloud Hypervisor, goes further still: each sandbox gets its own dedicated guest kernel. The host has no direct line of sight into guest memory or CPU accounting. Whatever signal escapes has to travel through guest-side instrumentation, the hypervisor's own balloon and stats virtio devices, a virtio-vsock channel to a guest agent, or the VMM's own host-side metrics stream. Northflank runs Kata Containers and gVisor depending on underlying infrastructure; these tiers aren't fixed design choices so much as a spectrum platforms slide along depending on what the hardware permits.
Cloudflare Sandboxes sit on the container end of that spectrum, built on Cloudflare Containers and reaching general availability on April 13, 2026. The container model is still a live, shipping choice for platforms that would rather have the visibility than the tighter isolation a dedicated guest kernel buys.
None of these three tiers beats the others. Each trades visibility for isolation strength in a different amount, and gVisor and microVM setups aren't a downgrade in observability so much as a forcing function: they push all the real profiling work into the guest process itself, which turns out to be the more durable approach anyway once agents start running for hours instead of seconds.
In-process profiling: the instrumentation layer that works across all isolation boundaries
Once host-side tools are off the table (which happens under gVisor and fully under microVM isolation), there's one option left, and it's easier to describe than to do well: put the profiler inside the sandbox, next to the code it's measuring.
For CPU, sampling profilers built for the language runtime handle this cleanly. py-spy for Python, async-profiler for the JVM, pprof for Go: each one runs as a thread or a lightweight sidecar inside the guest, and none needs host kernel access to work. Flame graphs get built entirely in-process from the collected samples, and the data leaves through a file, stdout, or a small HTTP endpoint served from inside the sandbox.
Sampling frequency is the lever that actually matters, and the tradeoff is blunt: sample more often and the profile sharpens, but the overhead starts competing with the workload being measured. AI-generated code makes this worse, since its behavior doesn't follow the predictable rhythm of hand-written services. Adaptive sampling, ramping frequency up when something anomalous appears and backing off during idle stretches, keeps the noise down without losing the moments that matter. For agents running indefinitely, continuous low-rate sampling with windowed aggregation beats a stop-the-world snapshot, which captures one instant and tells an engineer almost nothing about a session that's been running for six hours.
Memory profiling follows similar logic, with one wrinkle to take seriously. tracemalloc in Python and Memray capture allocation call stacks without leaving the guest. But RSS, heap usage, and sandbox-allocated memory are three separate numbers, and treating them as interchangeable produces a misleading profile. A profile that reports "heap usage" without saying which of the three it measured gives no real signal. It's handing over a number that sounds precise and isn't.
This bites hardest in the install-import-execute-teardown cycle a lot of AI-generated code runs through repeatedly. That pattern produces memory fragmentation that drives RSS growth a heap profiler alone won't explain, because nothing is leaking in the sense a heap profiler is built to catch. Memory is just fragmenting across allocations that each look fine on their own. Pairing heap profiling with /proc/self/smaps or the platform's own memory stats closes that gap.
None of this in-process tooling can see the sandbox's own overhead. The hypervisor, the Sentry process under gVisor, the container shim, whatever machinery the isolation layer itself runs, all of it sits outside what a profiler inside the guest can observe. Seeing that layer takes a second observability path entirely, which the next section deals with.
Exporting profiling signal out of the sandbox: the data paths that survive isolation
Building a profile inside the sandbox is half the job. Getting it out is a separate problem, and it's one a lot of naive instrumentation gets wrong the first time it's tried.
Hardened sandbox platforms block private subnets by default: private and loopback subnets are commonly off-limits for outbound traffic unless someone explicitly allows them. A metric exporter that assumes it can phone home to a localhost collector or an internal service endpoint will run without a single error and quietly drop every data point it tries to send. No crash. No log line. Just an empty dashboard and a false sense that everything's fine.
Four paths reliably get data out under that kind of network lockdown, in order of how much plumbing they need. Writing profiles straight to the sandbox filesystem and pulling them out afterward, through a file download, a mounted volume, or a sync to object storage, works no matter what network policy is in place. Streaming structured JSON to stdout or stderr works too, and it's the cheapest option overhead-wise since the sandbox runtime's own logging layer is already capturing that stream, so there's no separate pipe to build. Explicit egress to an external telemetry endpoint, OTLP over HTTPS to a collector outside the sandbox, works as long as that destination is an allowed external address configured before execution starts, not a private subnet discovered mid-run. And some platforms expose metrics directly at the orchestration layer: per-sandbox CPU and memory stats pollable from outside with no code running inside the sandbox.
OpenTelemetry earns its place here specifically because OTLP traces and metrics can carry profiling spans right alongside the rest of an agent's distributed trace. That keeps profiling data in the same pipeline as everything else being collected about the agent, rather than standing up a second, parallel system just for performance signal. Fewer pipelines, fewer places for something to quietly break.
One volume problem deserves attention before it turns into a bill of its own. Agents that fan out into many parallel sandbox instances multiply metric volume fast, and shipping raw samples from every single instance gets expensive in a hurry. Pre-aggregating inside the sandbox, building histograms and summaries before anything leaves the guest, is what keeps that volume from spiraling as concurrency climbs.
How stateful, long-running agents change what CPU and memory profiling needs to capture
An ephemeral sandbox and a long-running agent are not the same profiling target. Treating them as if they were is how a profiling setup that worked fine at launch quietly goes stale a few months later.
In the ephemeral model, profiling is a single-session concern: run the sandbox, get a result, throw it away. Peak memory and CPU at the moment the task finishes is the number that matters most, and a snapshot at completion tells the whole story, because there's only one session to tell a story about.
Stateful agents break that model completely. Memory grows across sessions as state accumulates, tool results pile up, and context expands, so a profile taken at session start looks nothing like one taken twelve hours in. What matters at that point is the trend line, not a snapshot. It's the trend line. Is memory climbing in a straight line? Plateauing? Spiking around one specific class of tool call? Those questions only get answered by data collected continuously, not by checking in once and calling it done.
Checkpoint and rollback mechanisms sit right at the intersection of infrastructure cost and application-level profiling, and they add a wrinkle of their own. Research on this problem (arXiv:2605.22781) found that existing checkpoint and rollback mechanisms duplicate the entire sandbox state on every checkpoint, and that duplication adds meaningful latency overhead. That overhead appears in a CPU profile as a spike that looks exactly like an application bug. It's infrastructure cost wearing an application bug's clothes, and an engineer who doesn't know to look for it can burn an afternoon debugging code that was never the problem.
DeltaBox, described in that same research, takes the opposite approach: DeltaFS and DeltaCR track only the incremental changes between checkpoints, using copy-on-write filesystem layers and incremental memory dumps instead of duplicating everything from scratch each time. The benchmark numbers back that up: 14 milliseconds per checkpoint, 5 milliseconds per rollback. At that latency, checkpoint events are cheap enough to double as profiling markers in their own right, timestamped directly into the profiling timeline without meaningfully distorting the workload being measured. That's a genuinely different posture toward checkpointing than the full-duplication model. In a runtime doing full-state checkpoint and rollback, checkpoint events have to be filtered out of a CPU profile or they'll dominate the signal and drown out everything else. In a DeltaBox-style runtime, checkpoint frequency becomes a useful, fine-grained profiling signal instead of noise that needs stripping.
Session lifecycle policy shapes all of this too, and it's easy to overlook until data just goes missing one day. Platforms that auto-stop sandboxes after a period of inactivity need profiling data flushed before that idle threshold hits, not at explicit shutdown, because there may be no explicit shutdown to hook into. Northflank, by contrast, supports indefinite runtime with no forced time limit, which raises the opposite problem: profiling has to handle sessions of unbounded length without ever running out of storage. Ring buffers and rolling aggregation windows solve that by design, discarding old detail to keep whatever's recent and relevant.
Resource limits, billing models, and how profiling affects what you pay
Profiling data and the monthly invoice are more tightly linked than most engineers expect, and the billing model in place tells you exactly where to point a profiler first.
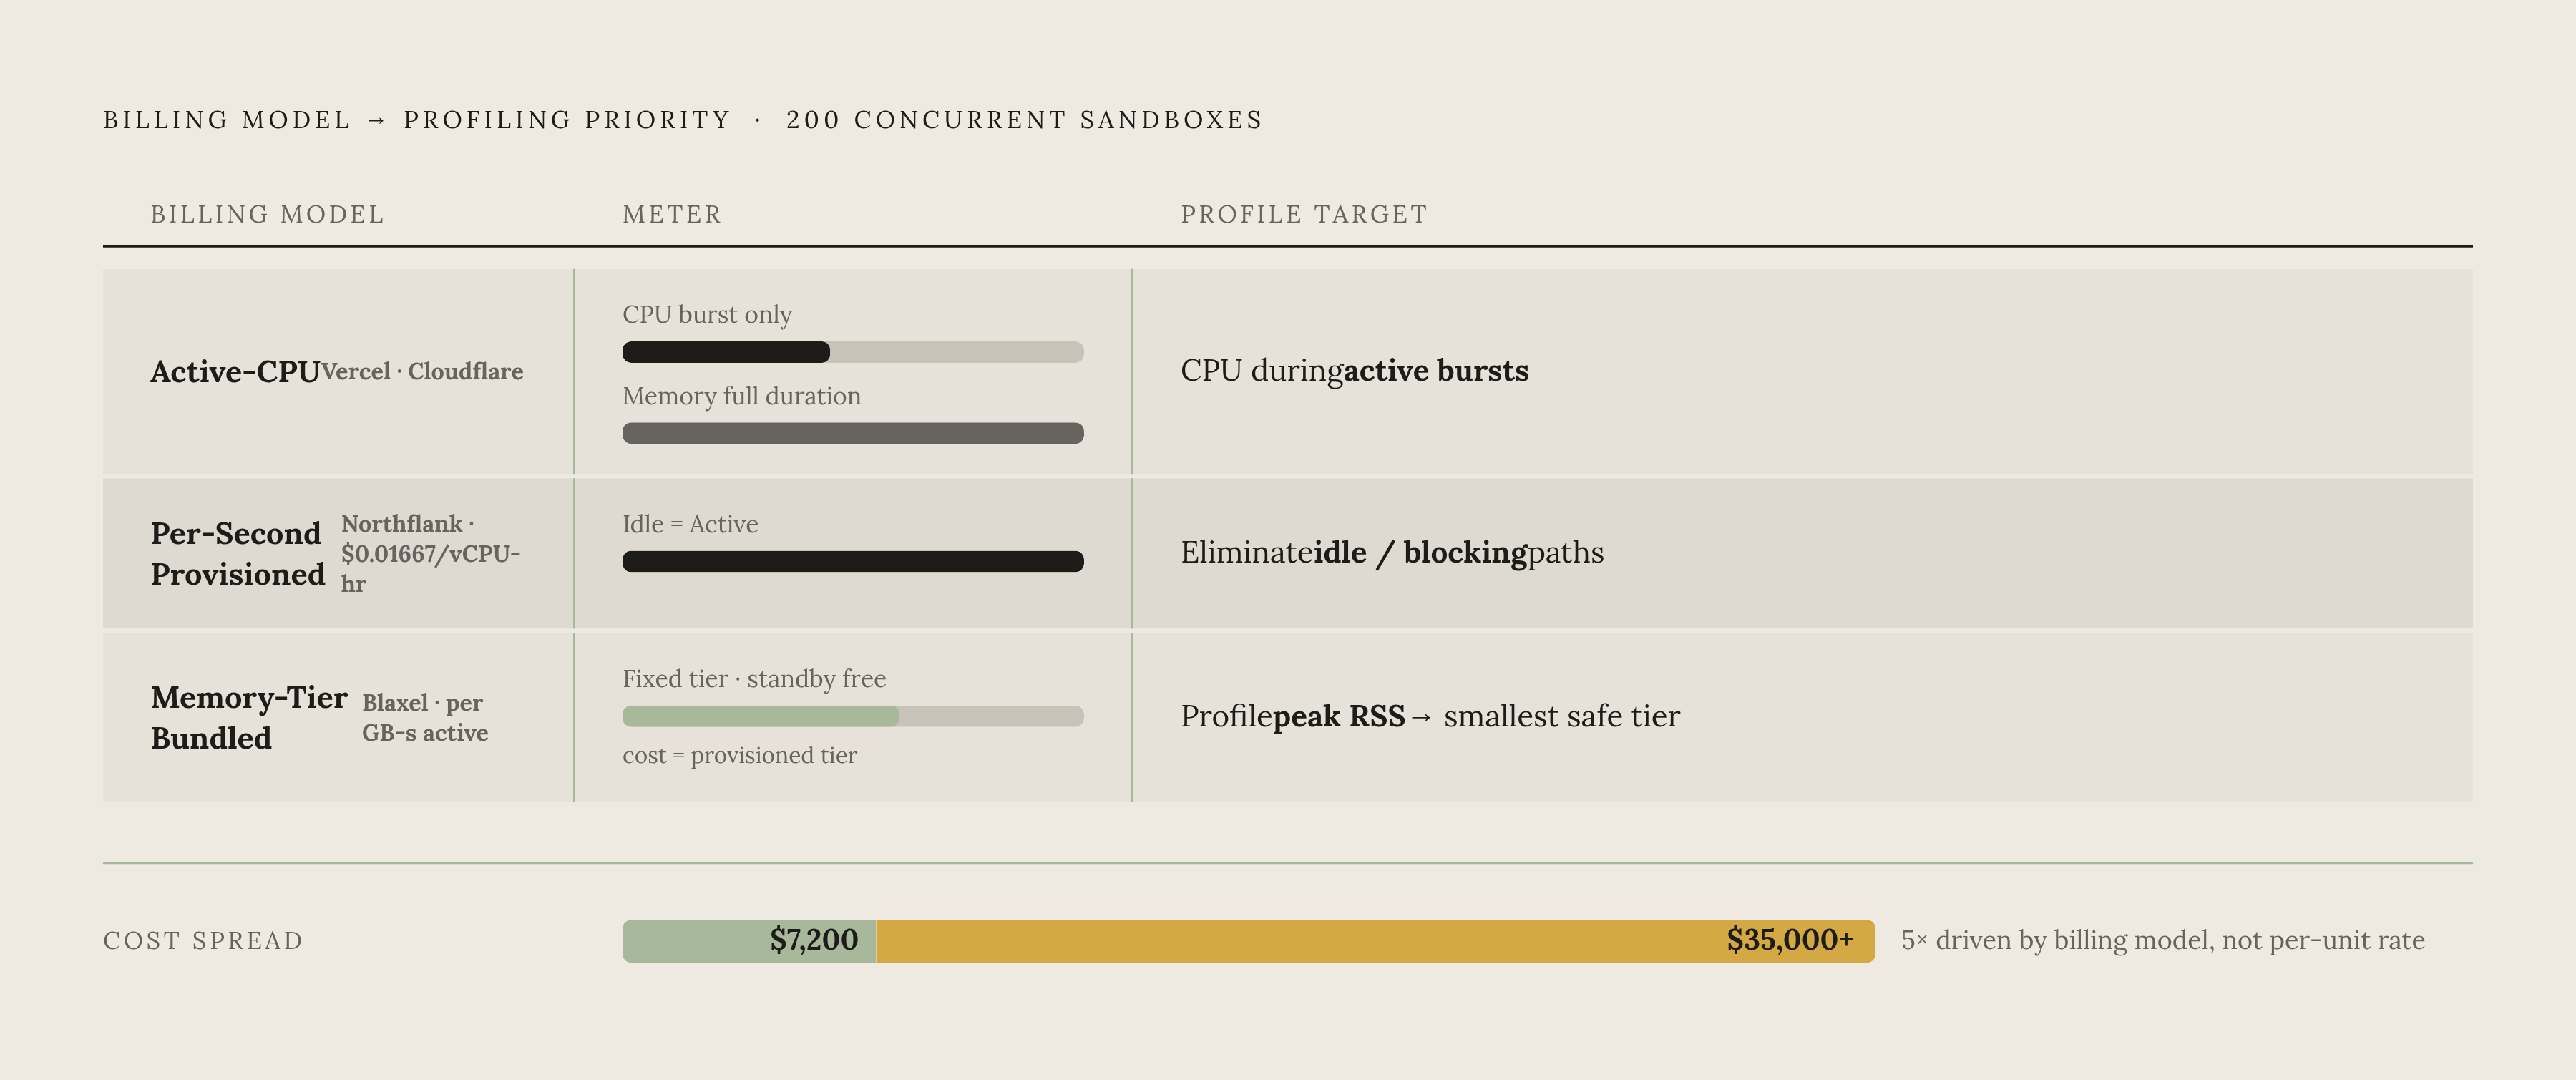
Platforms that bill for active CPU, Vercel Sandbox and Cloudflare Sandbox among them, don't charge CPU time for the stretches an agent spends waiting on an LLM API to respond. That makes CPU profiling during active execution bursts the highest-value target, since that's the only stretch of time actually showing up as a charge. Memory tells a different story on these same platforms: it's billed against provisioned resources for the full duration of the sandbox, active or idle, so the memory side of the bill doesn't care whether the agent is computing or just sitting there.
Per-second billing on provisioned resources removes that distinction. The sandbox costs the same whether the agent is doing real work or blocked on I/O, and idle time carries identical cost to active time. Under that model, hunting down the code paths causing unnecessary blocking is a direct line-item reduction on the bill. It's a direct line-item reduction on the bill.
Memory-tier bundled pricing changes the math again, and this is the model most likely to bite a team that isn't watching closely. Cost gets fixed at the memory tier chosen when the sandbox is provisioned, which is precisely the setup that encourages over-provisioning as a defensive reflex against out-of-memory errors. Blaxel takes a different approach, with usage-based per-GB-second pricing billed only during active compute, and standby time costing nothing. Profiling actual peak RSS is what lets a team pick the smallest tier that still avoids OOM, instead of guessing high and paying for headroom nobody ever uses.
Published rates give a sense of what's actually at stake. Northflank lists $0.01667 per vCPU-hour, billed. Scale that to 200 concurrent sandboxes and total cost across the platforms compared ranges from roughly $7,200 to more than $35,000. That five-fold spread comes down to differences in billing model, not just differences in the headline per-unit rate, and it's the single clearest argument for reading the pricing page before picking an isolation tier.
A flame graph showing an agent burning most of its active CPU time inside a dependency installation loop (a pattern that recurs often enough in AI-generated code to be recognizable on sight) is doing two jobs at once. It's a performance diagnosis and a cost report in the same image. Fixing that loop cuts latency and cuts the bill in the same motion, about as clean a return as profiling work offers anywhere in this stack.
Practical instrumentation patterns for the most common AI agent sandbox workloads
Different workloads call for different profiling setups. Forcing one pattern onto all of them wastes effort in one direction or leaves a blind spot in the other, so it matters which pattern fits which job rather than reaching for a single default.
Short-burst code execution, the kind an AI coding assistant or a CI/CD test runner produces, runs cold start through task completion in seconds to minutes, often inside a sandbox that gets thrown away right after. What matters here is wall time, peak memory at completion, and the ratio of cold-start overhead to actual task execution. Wrapping the agent's main execution block with timing calls and a tracemalloc or Memray capture, then emitting a structured summary to stdout on exit, is usually enough, since the sandbox runtime's own log aggregation picks it up from there without extra plumbing. Cold-start numbers deserve a specific callout: published benchmarks across platforms range from sub-90 milliseconds to around 150 milliseconds. If cold-start overhead eats a bigger share of total time than the task itself, the provisioning path is what needs profiling, not the application code, and no amount of tuning inside the sandbox fixes a problem that lives outside it.
Long-running agents with tool use and repeated LLM round-trips need a different rhythm. Sessions stretch across hours, memory accumulates as tool calls pile up, and the round-trips themselves punch long idle gaps into any CPU trace. Memory trend over time rather than a single peak, CPU distribution across distinct phases (planning, tool execution, waiting on a response), and allocation hotspots that grow monotonically instead of leveling off are what to track. A continuous low-rate sampling profiler running as a daemon thread, flushing to the sandbox filesystem every few minutes instead of waiting for exit, is the right shape here. Annotating that timeline with tool-call events makes it possible to correlate a memory jump with a specific action after the fact. Flush before any inactivity auto-stop threshold hits, not after, and set the flush interval to roughly half whatever the platform's idle window is, so a slow session never loses its last few minutes of data to a shutdown it never saw coming.
Tree-search and reinforcement-learning agents that checkpoint and roll back sandbox state at high frequency run straight into the checkpoint-overhead cost described in the section above. On a runtime doing full-state checkpoint and rollback, every checkpoint event needs to be flagged and stripped from the CPU profile, or the profile ends up measuring checkpoint duplication instead of the search or training logic it was supposed to capture. On a runtime built around incremental checkpointing, the kind DeltaBox represents, those checkpoint events are cheap enough to leave in as timeline markers, giving a much finer view of exactly which search branch or training step is burning resources. Either way, the profiling setup needs to know which checkpoint mechanism it relies on before a single flame graph gets trusted.